Showing posts with label pentaho. Show all posts
Showing posts with label pentaho. Show all posts
Friday, February 13, 2015
Columns Grand total in Table component of Pentaho CDE
Hi Guys,
Table component has no direct feature of adding column totals as of this post written date(July 2nd 2013)....
Here is the pentaho community & data tables shared java script to find the Summation of columns in Table component.
Write below code in Draw Function of Table Component.
function f() {
var grandTotalRow = "<tfoot><tr><td>Total</td>";
for(i=1;i<4;i++) {
var total=0;
var rows = $(# + this.htmlObject + tbody tr);
rows.each(function() {
var cellVal = parseFloat($(td:eq(+i+), this).text().replace(,,));
if(!isNaN(cellVal)){
total+=cellVal;
}
});
grandTotalRow += "<td>"+total.toFixed(2);+"</td>";
}
grandTotalRow += "</tr></tfoot>";
if($(#+this.htmlObject+ tfoot).length===0)
$(#+this.htmlObject).find(table).append(grandTotalRow);
}
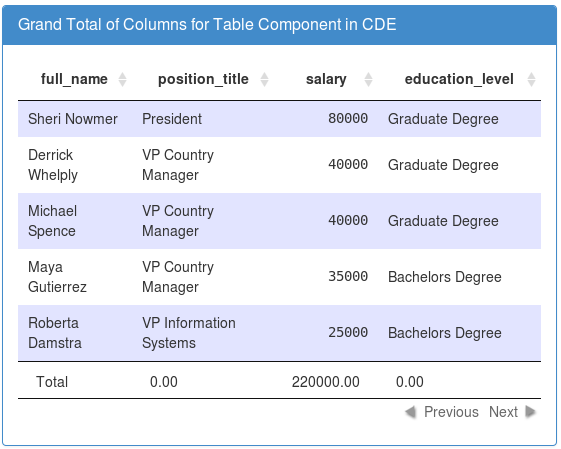
Sample output:
References :
https://www.datatables.net/forums/discussion/17132/summary-footer-row
http://forums.pentaho.com/showthread.php?94187-Table-Component-Grand-total
Example :
https://metrics.mozilla.com/data/content/pentaho-cdf-dd/Render?solution=metrics2&path=%2FgetInvolved&file=getInvolved.wcdf
Table component has no direct feature of adding column totals as of this post written date(July 2nd 2013)....
Here is the pentaho community & data tables shared java script to find the Summation of columns in Table component.
Write below code in Draw Function of Table Component.
function f() {
var grandTotalRow = "<tfoot><tr><td>Total</td>";
for(i=1;i<4;i++) {
var total=0;
var rows = $(# + this.htmlObject + tbody tr);
rows.each(function() {
var cellVal = parseFloat($(td:eq(+i+), this).text().replace(,,));
if(!isNaN(cellVal)){
total+=cellVal;
}
});
grandTotalRow += "<td>"+total.toFixed(2);+"</td>";
}
grandTotalRow += "</tr></tfoot>";
if($(#+this.htmlObject+ tfoot).length===0)
$(#+this.htmlObject).find(table).append(grandTotalRow);
}
Sample output:
References :
https://www.datatables.net/forums/discussion/17132/summary-footer-row
http://forums.pentaho.com/showthread.php?94187-Table-Component-Grand-total
Example :
https://metrics.mozilla.com/data/content/pentaho-cdf-dd/Render?solution=metrics2&path=%2FgetInvolved&file=getInvolved.wcdf

Tip Export JPivot output to excel in Pentaho 5 x version By default export to Excel is disabled in 5 x server
Hi Readers,
This tip is useful to enable the "Print" property of JPivot output to Export into Excel sheet.
By default in pentaho 5.x version servers it is disabled.
Un comment below code in plugin.spring.xml file
<bean id="Print" class="org.pentaho.jpivot.proxies.ProxyPrintServlet"/>
Location of the file is :
<YourDrivePath>/biserver-ce/pentaho-solutions/system/pentaho-jpivot-plugin
NOTE : Once you enable the code, stop the BI server and start again. [Bz it is a configuration file and changes will be affected iff you restart the server.]
Test: In the xml file it was suggested to replace with fop-0.20.5, but I didnt do it instead just uncommented the code and tested which is worked as expected.. If you still unable to get export work , you might have to replace the specified jar file.
:-)
This tip is useful to enable the "Print" property of JPivot output to Export into Excel sheet.
By default in pentaho 5.x version servers it is disabled.
Un comment below code in plugin.spring.xml file
<bean id="Print" class="org.pentaho.jpivot.proxies.ProxyPrintServlet"/>
Location of the file is :
<YourDrivePath>/biserver-ce/pentaho-solutions/system/pentaho-jpivot-plugin
NOTE : Once you enable the code, stop the BI server and start again. [Bz it is a configuration file and changes will be affected iff you restart the server.]
Test: In the xml file it was suggested to replace with fop-0.20.5, but I didnt do it instead just uncommented the code and tested which is worked as expected.. If you still unable to get export work , you might have to replace the specified jar file.
:-)
Thursday, February 12, 2015
Table Component Tooltip in Pentaho CDE Showing hidden column values as tool tip on 1st column or any column of table component
Hi Guys,
A requirement make you go in-depth of subject. Few days back I have got a requirement to show tool tip on table component column(s).
Id like to thank you to pentaho forum for their support in working with java script/jQuery in achieving this functionality.
Requirement :
Take a single query of 4 columns, hide 4th column and its values on table component and show this hidden column values as tool tip on the first column of table component.
In other words, Using CDA get 4 columns output but get only 1st 3 columns on table component and show the 4th column(hidden column) values as tool tip on the 1st column of table component.
Example Environment :
Pentaho C-Tools of TRUNK version(after 14 version trunk)
Pentaho BA server 5.1.0 stable
PostgreSQL foodmart database for querying purpose.
Here Id like to concentrate on the core part of the example hence design your layout.
What you can learn in this post ?
1. Query component usage.
2. How to store result set in a parameter using query component.
3. How to hide columns using java script/jQuery script on table component.
4. How to make use of tipsy function to show tooltip on table component.
Layout section :
Design as per your requirement
Data source section :
Query 1 :
SELECT employee_id,full_name,gender,position_title from employee limit 10
Sample image
 Query output:

Components panel section
Here for this post you need to work out with a parameter, a query component and table component.
first lets have a parameter : Name it as tooltipValues

Query component :
You will be storing the query output in parameter using query component.

Write below Code in PostFetch Expressionof Query Component :
function f2(data){
var tooltipValues = [];
for(var i=0; i <data.resultset.length; i++){
tooltipValues.push(data.resultset[i][3]);
}
alert(tooltipValues);
alert("length="+data.resultset.length);
return tooltipValues;
}
Now the table Component
Add the table component, give a name to it, and the data source for it,(in this example give the same data source i.e., Datasource=query1_table) & the HTML Object here it is Panel_1
Write below code in Post Execution of table component
function myTip()
{
$(th:nth-child(4),td:nth-child(4)).hide();
$(#Panel_1 tr td:first-child).each(
function(index){
$(this).tipsy({title: function(){ return tooltipValues[index][3] ; }});
}
);
}
In the above code
Using hide() function you are hiding the result of 4th column
#Panel_1 is the HTML Object
Using tipsy() function you are showing the 4th column values as tooltip on the 1st column.
td:first-child, you are telling the jQuery to show the tooltip values on 1st column of the table component.
Thats it you are done...!!!
Save the dashboard and see the preview.
Preview/Observations :
Image 1 :

Image 2:

Image-3:

Source Code of this example :
Download here
Thank you for reading this article.
A requirement make you go in-depth of subject. Few days back I have got a requirement to show tool tip on table component column(s).
Id like to thank you to pentaho forum for their support in working with java script/jQuery in achieving this functionality.
Requirement :
Take a single query of 4 columns, hide 4th column and its values on table component and show this hidden column values as tool tip on the first column of table component.
In other words, Using CDA get 4 columns output but get only 1st 3 columns on table component and show the 4th column(hidden column) values as tool tip on the 1st column of table component.
Example Environment :
Pentaho C-Tools of TRUNK version(after 14 version trunk)
Pentaho BA server 5.1.0 stable
PostgreSQL foodmart database for querying purpose.
Here Id like to concentrate on the core part of the example hence design your layout.
What you can learn in this post ?
1. Query component usage.
2. How to store result set in a parameter using query component.
3. How to hide columns using java script/jQuery script on table component.
4. How to make use of tipsy function to show tooltip on table component.
Layout section :
Design as per your requirement
Data source section :
Query 1 :
SELECT employee_id,full_name,gender,position_title from employee limit 10
Sample image
Components panel section
Here for this post you need to work out with a parameter, a query component and table component.
first lets have a parameter : Name it as tooltipValues
Query component :
You will be storing the query output in parameter using query component.
Write below Code in PostFetch Expressionof Query Component :
function f2(data){
var tooltipValues = [];
for(var i=0; i <data.resultset.length; i++){
tooltipValues.push(data.resultset[i][3]);
}
alert(tooltipValues);
alert("length="+data.resultset.length);
return tooltipValues;
}
Now the table Component
Add the table component, give a name to it, and the data source for it,(in this example give the same data source i.e., Datasource=query1_table) & the HTML Object here it is Panel_1
Write below code in Post Execution of table component
function myTip()
{
$(th:nth-child(4),td:nth-child(4)).hide();
$(#Panel_1 tr td:first-child).each(
function(index){
$(this).tipsy({title: function(){ return tooltipValues[index][3] ; }});
}
);
}
In the above code
Using hide() function you are hiding the result of 4th column
#Panel_1 is the HTML Object
Using tipsy() function you are showing the 4th column values as tooltip on the 1st column.
td:first-child, you are telling the jQuery to show the tooltip values on 1st column of the table component.
Thats it you are done...!!!
Save the dashboard and see the preview.
Preview/Observations :
Image 1 :
Image 2:
Image-3:
Source Code of this example :
Download here
Thank you for reading this article.
Subscribe to:
Posts (Atom)